
How to Check PC Temps (Monitor CPU & GPU)
Table of Contents
You were in the middle of an intense gaming session. Everything was running smoothly — until it wasn’t. Your screen went black. No warning, no error message, just silence. When you rebooted and checked your system, you realized the culprit was something you had never once thought about: temperature.
That moment happens to thousands of PC users every single day. And the frustrating part? It is almost entirely preventable.
Whether you game for hours, edit videos, run heavy workloads, or simply browse and stream, your CPU and GPU are constantly generating heat. When that heat builds up without proper monitoring, it silently destroys performance, shortens hardware life, and eventually causes failures that cost real money to fix.
This guide gives you everything you need — the tools, the steps, the knowledge — to check your PC temps today, understand what those numbers mean, and take action before a problem becomes a disaster.
Why Monitoring Your PC Temperature Is Non-Negotiable
Most people treat temperature monitoring as something only overclockers or hardcore enthusiasts need to worry about. That thinking is wrong, and it is costing people hardware every single day.
Here is what actually happens inside your PC when temperatures climb too high:
Thermal throttling kicks in. Your CPU and GPU are designed to protect themselves. When they detect dangerously high temps, they automatically reduce their clock speeds to generate less heat. The result is that your PC slows down — sometimes dramatically — right when you need it to perform most.
Hardware degradation accelerates. Every component inside your PC has a thermal tolerance. Running consistently at high temperatures degrades the physical integrity of silicon chips, solder joints, and capacitors over time. Research has consistently shown that sustained temperatures above 90°C can meaningfully shorten a CPU’s functional lifespan.
Unexpected shutdowns damage your data. When your system hits a critical temperature threshold, it shuts down instantly — no graceful close, no save prompt. Unsaved work disappears, and in some cases, files being actively written to storage can become corrupted.
Cooling problems go unnoticed for months. Dust accumulation, dried thermal paste, and failing fans do not announce themselves. Without temperature monitoring, these problems can silently cook your hardware for months before any obvious symptom appears.
The bottom line is simple: checking your PC temps regularly takes minutes and costs nothing. Replacing a CPU or GPU because you ignored the warning signs costs hundreds.
What Are Safe PC Temperatures? Your Reference Guide
Before you start monitoring, you need to know what you are actually looking at. Safe temperatures vary depending on the component, the manufacturer, and whether your system is idle or under heavy load.
| Component | Idle Temp (Safe) | Load Temp (Safe) | Danger Zone |
|---|---|---|---|
| Intel CPU | 30°C – 45°C | 65°C – 85°C | Above 95°C |
| AMD CPU (Ryzen) | 30°C – 50°C | 70°C – 90°C | Above 95°C |
| NVIDIA GPU | 30°C – 45°C | 65°C – 85°C | Above 95°C |
| AMD GPU (Radeon) | 30°C – 45°C | 65°C – 85°C | Above 100°C |
| NVMe SSD | 25°C – 40°C | 40°C – 70°C | Above 80°C |
| Motherboard | 20°C – 40°C | 40°C – 70°C | Above 80°C |
A few important things to keep in mind when reading these numbers:
- Idle temps are what your system runs at when you are doing light tasks — browsing, watching a video, sitting at the desktop.
- Load temps are what you will see during gaming, video rendering, or any CPU/GPU-intensive activity.
- AMD Ryzen processors, particularly the newer generations, are designed to run hotter than Intel chips at idle. Seeing 70°C–80°C on a Ryzen CPU at load is completely normal.
- Your GPU’s VRAM (video memory) can also run hot independently of the GPU core. Some monitoring tools display this separately, so pay attention to both readings.
How to Check PC Temps Using Built-In Windows Tools
You do not always need to install third-party software to get a temperature reading. Windows itself and your PC’s firmware give you a couple of options right out of the box.
Method 1: Check CPU Temperature via BIOS/UEFI
Your PC’s BIOS or UEFI firmware has been displaying hardware temperatures long before Windows monitoring tools existed. It is the most direct way to get a reading, though it comes with a significant limitation: you can only read temps at idle, not under load.
Here is how to access it:
- Save all open work and restart your PC
- As soon as the screen goes dark and the system begins to boot, immediately press DEL, F2, or F10 (the key varies by motherboard manufacturer — it is usually displayed briefly on the boot screen)
- Once inside the BIOS, navigate to the section labeled Hardware Monitor, H/W Monitor, PC Health Status, or System Monitor depending on your motherboard brand
- Read the CPU temperature displayed — this is your idle temperature
- Exit the BIOS without making any changes by pressing F10 or selecting Exit Without Saving
This method is reliable and requires zero software, but it only tells you half the story. For real-world temperatures under load, you need a software solution.
Method 2: Check GPU Temperature via Windows Task Manager
If you are running Windows 11 (or an updated version of Windows 10), Task Manager has a built-in GPU temperature display that many users do not know about.
- Use Ctrl + Shift + Esc to launch the Task Manager.
- Click on the Performance tab in the left panel
- Select GPU from the list of components
- Look for the GPU Temperature reading displayed in real time
This gives you a live GPU temperature without installing anything. The catch is that Task Manager does not show your CPU temperature natively — for that, you will need one of the tools covered in the next section.
The Best Free Software to Check Your PC Temps
For complete, real-time temperature monitoring across every component in your system, dedicated software is the way to go. The good news is that the best tools available are completely free.
1. HWMonitor — Best Overall Temperature Monitor
HWMonitor, developed by CPUID, is one of the most widely trusted monitoring tools in the PC community. It displays current, minimum, and maximum temperature readings for every sensor in your system — CPU, GPU, motherboard, SSDs, and even individual CPU cores.
Why you should use it:
- Covers all components in a single interface
- Tracks minimum and maximum temps across a session so you can see how hot things got during a stress test or gaming session
- Clean, straightforward layout that is easy to read even as a beginner
- Completely free to download from cpuid.com
It is the first tool most experienced PC builders recommend to anyone who asks how to check PC temps, and for good reason.
2. MSI Afterburner — Best for GPU Monitoring and Gaming
MSI Afterburner is the gold standard for GPU monitoring, particularly among gamers. Despite carrying the MSI brand name, it works with graphics cards from every manufacturer — NVIDIA, AMD, and Intel Arc alike.
What makes it stand out:
- Displays GPU temperature, GPU usage percentage, clock speeds, VRAM usage, and fan speeds
- Pairs with RivaTuner Statistics Server (RTSS) to create an in-game on-screen display (OSD)
- The OSD lets you monitor temps in real time without ever leaving your game
- Also functions as an overclocking and undervolting tool for advanced users
If you game regularly, MSI Afterburner is arguably the single most useful piece of software you can have installed on your PC.
3. Core Temp — Best Lightweight CPU Temperature Monitor
Core Temp does one thing and does it exceptionally well: it monitors your CPU temperature. It is extremely lightweight, sits quietly in your system tray, and displays per-core temperature readings in real time.
Key advantages:
- Shows individual temperature for every CPU core, not just an average
- Supports both Intel and AMD processors
- Minimal system resource usage — you will barely notice it is running
- Can display temperatures directly in the Windows taskbar for constant at-a-glance monitoring
For users who want a no-fuss, always-visible CPU temperature readout, Core Temp is the cleanest solution available.
4. HWiNFO64 — Best for Advanced Full-System Monitoring
HWiNFO64 is the most powerful free monitoring tool available. It reads hundreds of sensor values from across your entire system and presents them in a detailed, customizable interface. It is the preferred choice for overclockers, system builders, and anyone who wants deep visibility into their hardware.
What sets it apart:
- Tracks CPU, GPU, motherboard, RAM, SSD, and fan data simultaneously
- Can log all sensor data over time for later analysis
- Pairs with RTSS (same tool used with MSI Afterburner) for a comprehensive in-game overlay
- Completely free from hwinfo.com
The interface can feel overwhelming at first, but once you identify the sensors you care about, it becomes an indispensable tool.
5. GPU-Z — Best Dedicated GPU Information Tool
GPU-Z, developed by TechPowerUp, is a focused tool that provides deep information specifically about your graphics card. It shows GPU temperature, memory temperature, core clock, memory clock, GPU load, and much more.
Why it is worth having:
- Lightweight and non-intrusive
- Displays both GPU core temperature and VRAM temperature separately
- Provides full technical specifications for your GPU
- Useful when diagnosing GPU-specific issues
Software Comparison at a Glance
| Tool | CPU Temp | GPU Temp | Free | In-Game Overlay | Best For |
|---|---|---|---|---|---|
| HWMonitor | ✅ | ✅ | ✅ | ❌ | General users |
| MSI Afterburner | ❌ | ✅ | ✅ | ✅ | Gamers |
| Core Temp | ✅ | ❌ | ✅ | ❌ | CPU focus |
| HWiNFO64 | ✅ | ✅ | ✅ | ✅ | Advanced users |
| GPU-Z | ❌ | ✅ | ✅ | ❌ | GPU detail |
How to Check PC Temps While Gaming (Real-Time Overlay Setup)

Checking temps while your game is actually running is one of the most valuable things you can do. Here is how to set up a live in-game temperature overlay using MSI Afterburner and RivaTuner.
Setting Up MSI Afterburner + RTSS
- Download and install MSI Afterburner — the installer includes RivaTuner Statistics Server, so accept that installation when prompted
- Open MSI Afterburner and click the Settings icon (the gear/cog symbol)
- Navigate to the Monitoring tab
- Scroll through the list and find GPU Temperature — click on it
- Check the box labeled Show in On-Screen Display
- Repeat this for any other metrics you want visible — GPU usage, CPU temperature, FPS, VRAM usage
- Click OK to save your settings
- Launch your game — your selected metrics will now appear as an overlay in the corner of the screen
Once this is set up, you will be able to see exactly how hot your GPU is getting during the most demanding moments of your gaming sessions. If you notice your GPU temperature climbing above 85°C consistently, that is a clear signal that your cooling needs attention.
How to Check PC Temps on a Laptop
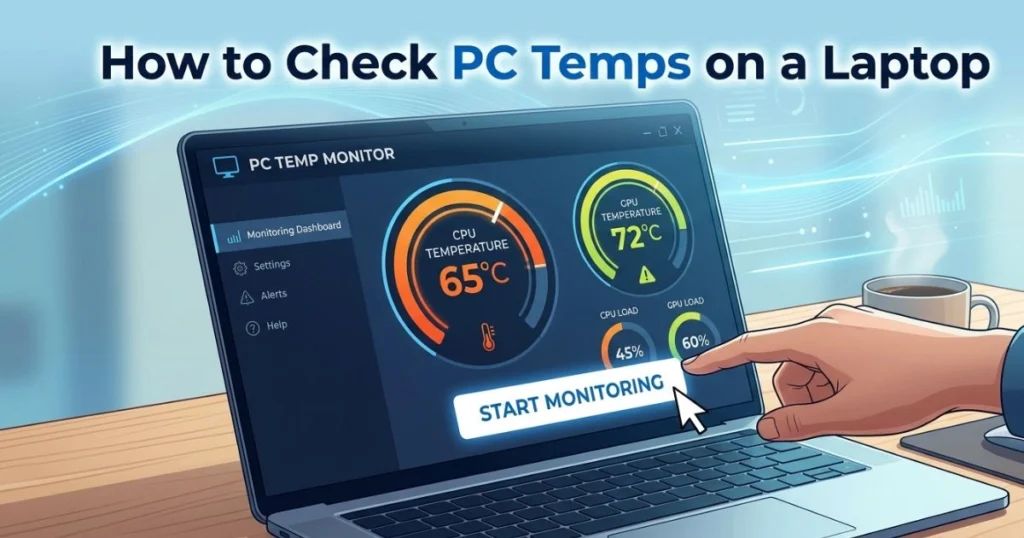
Laptops present a unique thermal challenge. Their compact design means less airflow, smaller heatsinks, and fans that have to work much harder to manage the same workloads. The same software tools — HWMonitor, Core Temp, HWiNFO64 — work perfectly on laptops, but the context around what is acceptable changes slightly.
What to keep in mind for laptop temperature monitoring:
- Laptop CPUs commonly run hotter than desktop CPUs under load — seeing 85°C–90°C during gaming or video export is not unusual for many models
- Anything consistently above 90°C on a laptop CPU deserves attention
- Check your GPU temps as well — integrated graphics run differently from dedicated laptop GPUs
- Thermal throttling is far more common on laptops because of space constraints
Practical steps to reduce laptop temps:
- Use your laptop on a hard, flat surface — soft surfaces like beds or couches block the bottom vents and can add 10°C–15°C to your temps
- Invest in a quality laptop cooling pad — these can reduce temperatures by 5°C–15°C depending on the model
- Make sure the air vents are not clogged with dust — use compressed air to clean them gently every few months
- Consider checking with the laptop manufacturer about re-pasting the CPU if the device is more than 2–3 years old
What to Do When Your PC Temps Are Too High
Knowing your temps is only half the job. If what you see is outside the safe ranges, here is a clear action plan to bring those numbers down.
Step 1: Clean Your PC
Dust is the single most common cause of overheating in PCs that are more than a year old. Dust accumulates on heatsink fins, fan blades, and air filters, dramatically reducing their ability to move and dissipate heat.
- Power down your PC completely and unplug it
- Use a can of compressed air to blow out the dust from all fans, heatsinks, and filters
- Pay special attention to the CPU cooler, GPU heatsink, and any case fans
- Do this every 3–6 months as routine maintenance
After cleaning, boot back up, run a short stress test, and check your temps again. In many cases, a thorough cleaning alone will drop temperatures by 5°C–15°C.
Step 2: Reapply Thermal Paste on Your CPU
Thermal paste is the compound that fills microscopic gaps between your CPU and its heatsink, allowing heat to transfer efficiently. Over time — typically after 2–4 years — thermal paste dries out, cracks, and loses its effectiveness. When this happens, your CPU temps can creep up by 10°C–20°C with no other obvious cause.
Recommended thermal pastes:
- Arctic MX-4 — reliable, affordable, excellent longevity
- Thermal Grizzly Kryonaut — premium option for high-performance builds
- Noctua NT-H1 — trusted by builders worldwide
Reapplying thermal paste is a straightforward process that can deliver dramatic results. If your PC is over two years old and running hot despite clean fans, this is your most likely fix.
Step 3: Improve Your Case Airflow
Even a spotlessly clean PC can run hot if the airflow inside the case is poorly configured. Air needs a clear path: cool air enters the front or bottom, passes over components, and warm air exits through the rear and top.
- Position fans so that front and bottom fans pull cool air in and rear and top fans push warm air out
- Tidy up your cables — a rats nest of cables in the middle of the case disrupts airflow significantly
- Consider adding additional case fans if your case currently only has one or two
- Positive air pressure setups (slightly more intake than exhaust) help minimize dust intake while maintaining good airflow
Step 4: Undervolt Your CPU or GPU
Undervolting means reducing the voltage your processor runs at without reducing its clock speed. Less voltage means less heat generated, often with zero performance loss and sometimes even a performance gain due to reduced thermal throttling.
- Intel CPUs: Use Intel Extreme Tuning Utility (Intel XTU)
- AMD Ryzen CPUs: Use AMD Ryzen Master
- GPU (any brand): Use MSI Afterburner’s voltage/frequency curve editor
Undervolting takes some experimentation to find the right values for your specific chip, but the results are worth the effort — drops of 10°C–20°C are common.
Step 5: Upgrade Your CPU Cooler
If you are running on a stock cooler — the one that came in the box with your CPU — you may simply be asking more of it than it can deliver. Stock coolers are designed to handle standard workloads within spec, not extended gaming sessions or content creation workflows.
Upgrade options:
- Budget air cooling: Cooler Master Hyper 212 — an outstanding value upgrade that handles most mid-range CPUs comfortably
- High-end air cooling: Noctua NH-D15 — one of the best air coolers ever made, competes with many liquid coolers
- AIO liquid cooling: A 240mm or 360mm all-in-one cooler offers the best thermal performance for high-TDP processors and gives your build a cleaner look
For any CPU with a TDP above 65W being used in demanding workloads, stepping up from a stock cooler is one of the best investments you can make.
How Often Should You Check Your PC Temperatures?
- During gaming sessions: Monitor in real time using your OSD overlay
- After cleaning your PC: Run a 15-minute stress test and verify temps improved
- When you notice slowdowns: Thermal throttling is a common cause of sudden performance drops
- After building or upgrading: Always verify temps before assuming everything is fine
- When buying a used PC: Run Prime95 (CPU stress test) and FurMark (GPU stress test) and monitor temps closely before handing over any money
- Every 3–6 months: A routine check costs you five minutes and keeps you ahead of any developing problems
Conclusion
Your PC is doing a tremendous amount of work every time you sit down at it. Beneath the surface — behind every frame rendered, every file processed, every tab opened — your CPU and GPU are generating real heat that needs to go somewhere. When that heat is managed well, your system runs fast, stays stable, and lasts for years. When it is ignored, the consequences range from frustrating slowdowns all the way to permanent hardware damage.
The tools to monitor your PC temps are free. The process takes minutes. The knowledge you need is right here in this guide.
Start today. Download HWMonitor or Core Temp, run a quick check, and compare what you see against the safe temperature ranges in this article. If your numbers look healthy, great — now you know. If they do not, you have a clear action plan to follow.
Do not wait for a crash to make you take temperatures seriously. A few minutes of monitoring today is worth far more than an expensive repair bill tomorrow.
Frequently Asked Questions: How to Check PC Temps
What is a good CPU temperature while gaming? While gaming, a good CPU temperature is anywhere between 65°C and 85°C for most modern processors. Temperatures in this range indicate your cooler is managing the workload effectively. If your CPU regularly exceeds 90°C during gaming sessions, your cooling solution needs attention.
How do I check my PC temperature without installing software? You can check your PC temperature without software by entering BIOS/UEFI at startup (press DEL or F2 during boot) and navigating to the Hardware Monitor section. Windows 11 users can also see GPU temperature directly inside Task Manager under the Performance tab.
How do I check PC temps while gaming? Install MSI Afterburner and enable the on-screen display (OSD) through the Monitoring settings. This creates a real-time overlay showing your GPU and CPU temperatures while you play, without requiring you to alt-tab out of your game.
What is the best free software to check PC temps? HWMonitor is the best all-around free tool for checking PC temps across all components. MSI Afterburner is the best choice specifically for GPU monitoring and gaming overlays. Core Temp is ideal if you want a lightweight CPU-only solution.
Is 80°C too hot for a GPU? 80°C on a GPU under heavy gaming load is within normal range for most graphics cards. However, if your GPU is consistently hitting 90°C or above, it is worth investigating — clean the card’s heatsink and fans, ensure good case airflow, and check that the fan curve is configured correctly.
How do I check PC temps on Windows 11? On Windows 11, open Task Manager with Ctrl + Shift + Esc, go to the Performance tab, and select GPU to see its temperature. For CPU temperature, you will need a free third-party tool like Core Temp or HWMonitor, as Windows 11 does not display CPU temps natively.
Can overheating permanently damage my PC? Yes. Prolonged exposure to excessive heat degrades the silicon, solder connections, and capacitors inside your CPU, GPU, and motherboard. In severe cases, a single extreme overheating event can cause permanent damage. Regular temperature monitoring is your best defense against this outcome.